


How to do Fundamental Analysis of stocks
Welcome back to the new post where we are going to discuss the Fundamental Analysis. Most of us have come across this question that how to do the Fundamental Analysis (i.e, going through the Balance Sheet, Financials of the Company) and it is quite important for an investor as we are investing our money for a long term duration so we should know the each and every aspect of the stock which enhances our confidence in the investing.
The stock which is Fundamentally as well as Technically fit is the WINNING Stock of the future so this is quite important in this part we are going through the Fundamentals and in the upcoming part the Technicals.
Analysis of the Balance Sheet
In the markets, data is the blood, and in real life, doctors are also able to diagnose diseases through blood tests. Similarly, the Balance Sheet and other mandatory data are referred to as the blood of the body.
Key Matrices to look over
- Assets
- Liabilities
The Assets are referred to as those that are responsible for the inflow of money in the company. In simple words, the resources of the company which are used to earn money OR the resources through which money is incoming into the company (Jaha Se Paise Aate Hai). The high number of assets is appreciated (i.e, referred to as good)
The Liabilities are referred to as the Outflow of money in the company. The simple words the costing (i.e, paying the bills, charges, etc.) The best one is TOTAL ASSETS = TOTAL LIABILITIES the golden rule for analysing the assets and liabilities.
EX. Imagine that a person is having multiple sources of income, so that come into the ASSETS, and whatever bills (Electricity bills, DTH bills, internet bills) are the LIABILITIES that you have to pay on time.
Financials
The financial are very helpful to identify whether the company is MULTIBAGGER or MULTIBEGGER a small difference but a huge impact. Important aspects to be look after
Profit and Loss
The company that is consistently growing its profits year on year is preferred as best for investing. The most important thing is to know whether the company is profitable or not so this test is essential if it is in the red (loss), then you may avoid that stock and search for other opportunities.
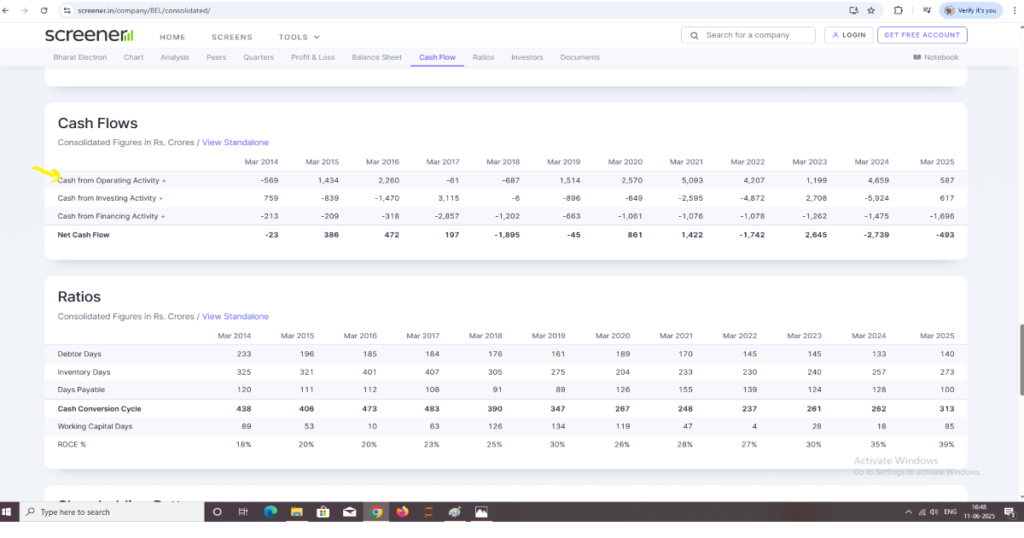
Cash Flows
The cash in the hands of the company is referred to as Cash Flows. Most important is that the company should have increasing [CASH FLOW FROM OPERATIONS] if it is positive and year on year increasing, then all is good and may be considered for investing. This indicates that the company is managing its cash effectively.
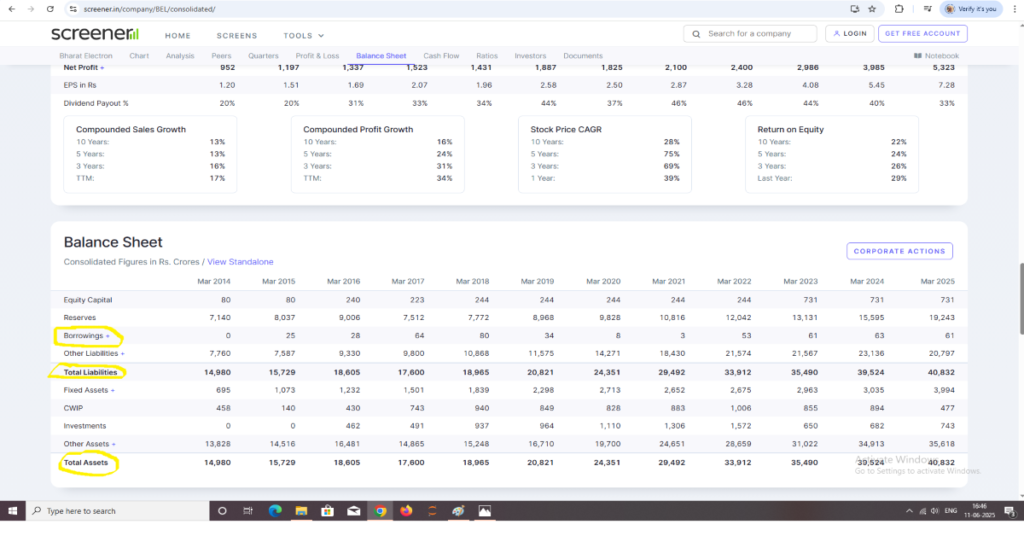
Debt
Most important is to look for the Debt, the company that is in Debt (i.e, LOAN) cannot give you excellent returns, you would not be able to beat the index as well.So its important that the debt-free company can give you more returns and result in consistent compounding of the wealth. As shown in the image highlighted by the yellow ink. The debt could be required for the expansion so it’s ok to have a debt but always make sure if the debt is for the expansion, so go through the concall and investor meetings available at the screener also make sure that the company is having enough assets to pay the debts.
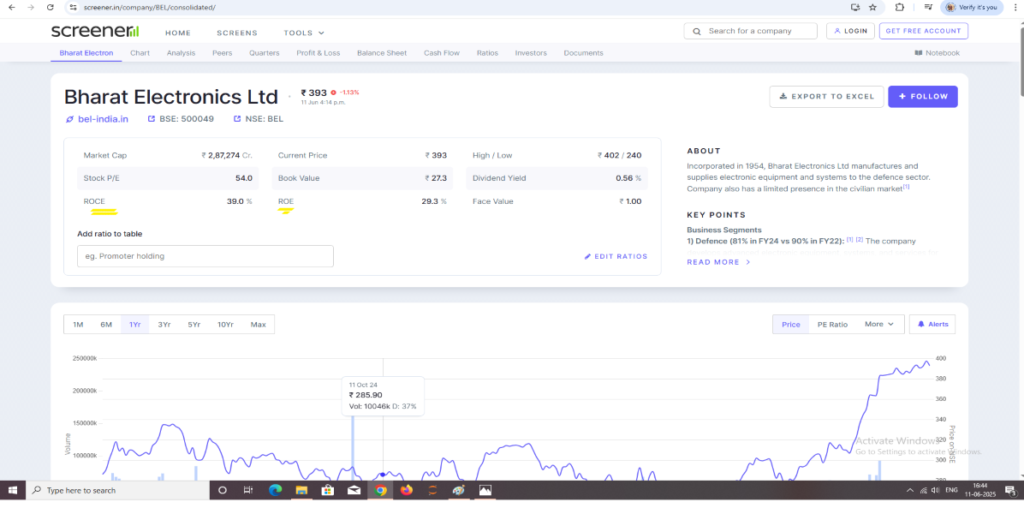
ROE and ROCE
ROE (Return on Investment)- The most important parameter to analyse is what rate of return you would get. The (ROE >=20) is referred to as great.
ROCE (Return on Capital Employed)- Another parameter to analyse the returns. The (ROCE >=20) is referred to as great. As shown in the image highlighted by the yellow ink.
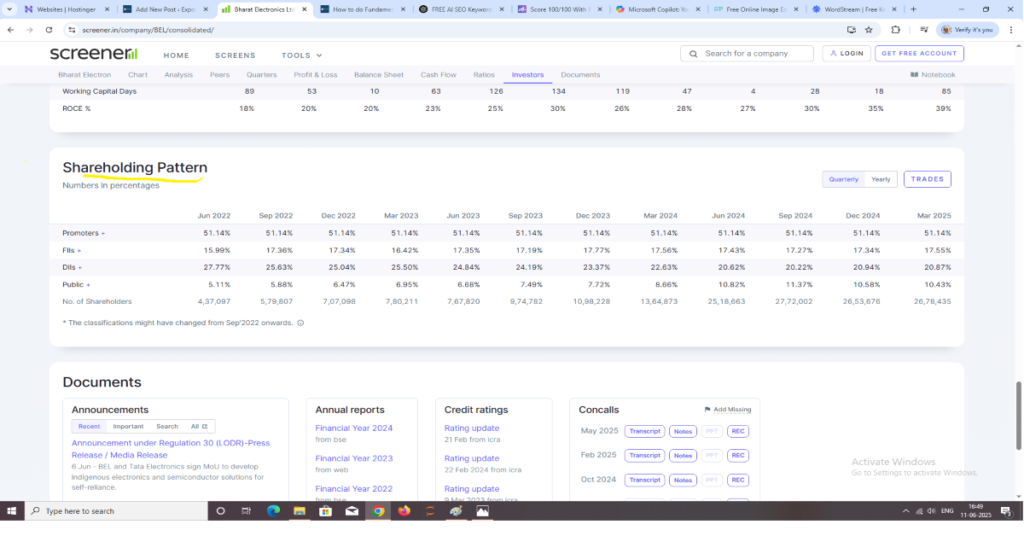
Shareholding
Another important parameter is the shareholding, it depicts the interest of the PROMOTERS, FII (FOREIGN INSTITUTIONAL INVESTOR), DII (DOMESTIC INSTITUTIONAL INVESTOR) the holdings should be (FII > =15%) same in case of (DII >=15%) the PROMOTER HOLDING as much as possible is great .
NOTE- In some stocks the PROMOTE HOLDING is very low or even zero still they are a good company if the FII and DII are investing.
Promoter Holding Pledge
Here, the promoter holding pledge should be zero (Green Flag or Good). If it is zero, then the stock is good; otherwise, don’t even buy a single share if the promoter share holdings are pledged (Red Flag or not good). If the holdings are pledged then it shows that the promoter of the company had raised capital or Debt by pledging the shares, which is not beneficial. Clearly, it shows that the promoter is going to exit the company, and so the stock price will fall, so don’t invest if the holdings are pledged.
Sales
The parameter that indicates the demand in the markets, if the sales are increasing in (Quarterly, Half Yearly, Yearly) then the company is great. A Consistent rise in sales is a Green Flag for the growth of a company and indicates that the Overcall Company is performing well and can upscale in the future.
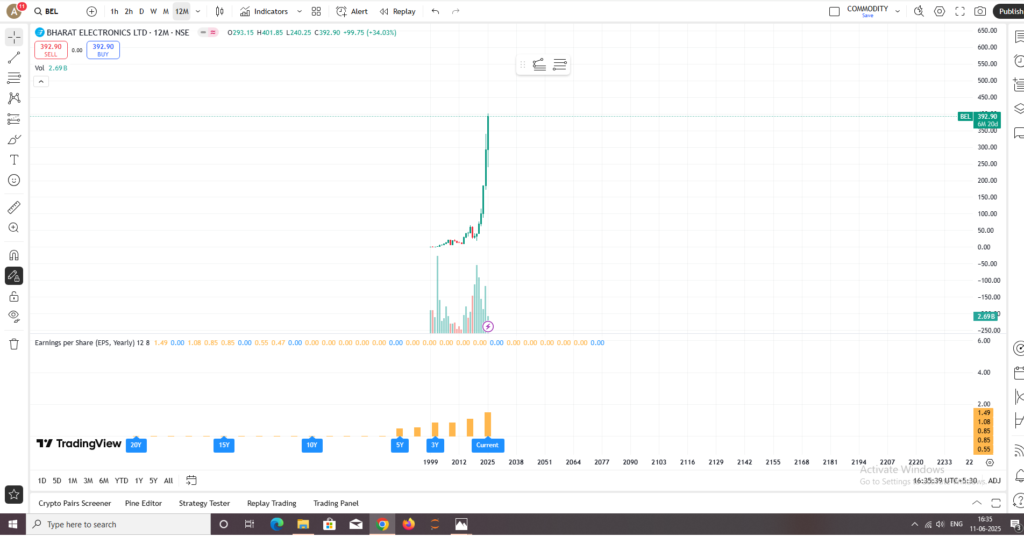
EPS (Earning per Share)
The parameter which depicts the real growth of the company, it is most important to analyse whether the stock is bullish only due to the sentiments or a real growth. To identify the bubble
Source – to get the Fundamental data of a stock for fundamental analysis
https://www.tradingview.com/#main-market-summary
See you in the next content
Checkout our Popular Posts – Which is better Sip Or Lumpsum
Till then STAY HUNGRY STAY BULLISH
1.What does “fundamental analysis” actually mean? It sounds complicated.
Think of it as being a detective for a company you want to invest in. Instead of just following hype, you’re looking at the company’s “blood test”—its financial health (like the Balance Sheet and Profit/Loss statements). The article explains this is how you build real confidence to invest your money for the long term, by checking if the company is actually healthy and growing
2.I get confused by the Balance Sheet. What’s the simple difference between “Assets” and “Liabilities”?
It’s simpler than it sounds!
Assets: These are all the things that bring money into the company. Think of them as the company’s resources used to earn money. More assets are generally a good thing.
Liabilities: This is all the money flowing out of the company. Think of it as the company’s costs, like paying bills, charges, and loans.
The “golden rule” the article mentions is when a company’s Total Assets equal its Total Liabilities, which shows a balanced book.
3.The post mentions checking for debt. Is all company debt a bad sign?
Not necessarily, but it’s something you have to be careful about. The post makes a great point that a “debt-free” company is ideal because it can use its money to grow instead of paying off loans. However, sometimes a company takes on debt for a good reason, like expansion (e.g., building a new factory). The key is to check why they have the debt and, more importantly, if they have enough assets to pay it back. DEBT is there in case of finance and NBFCs just research well and then invest.
4.What is “Promoter Holding Pledge,” and why is it such a huge red flag?
Yes,This is a big one. “Promoter Pledge” means the owners (the promoters) have used their own shares in the company as collateral to get a loan. The article is very clear on this: if you see this, it’s a major red flag (“don’t even buy a single share”). It suggests the promoters might be in financial trouble or are looking for a way to exit. If they can’t pay back their loan, the bank will sell their shares, which can cause the stock price to crash. A “zero” pledge is what you want to see.
5.Besides profit, what are one or two of the most important numbers to check for?
Profit is key, but it doesn’t tell the whole story. The article points out a few other crucial numbers:
ROE (Return on Equity) and ROCE (Return on Capital Employed): These numbers show how efficiently the company is using your money to make a profit. You want to see these numbers at 20% or higher.
EPS (Earning per Share): This shows the “real growth” of the company. If the EPS is rising consistently, it’s a great sign that the company is genuinely growing its business, and the stock price isn’t just up because of market hype.


Your article helped me a lot, is there any more related content? Thanks!