Welcome back, to the next part of the Technical Analysis in previous part we had discussed the importance of the Technical Analysis and it’s impact for making the firm Entry and Exit decisions. Now it’s the part 2 of the Series where we are going to study the indicators and some simple paterns which works in the volatile markets. To get the complete knowledge of the topic please check out part 1 as well.
How to Do Technical Analysis of Stocks – Step-by-Step Guide for Beginners Part 2
We are starting from the indicators and how they help in the markets ?
Indicators could be Leading Or Lagging but they create a huge imapct on the Timely Entry and Exits. To Plan the Entry, Stop Loss, Target, Exit as it is very crucial parameter to exit before the stock falls massively.
To master the One is enough, it depend one the person he/she can consider 1 Or 2 Indicators which is very use to for them instead of using the multiple indicators,by adding the multiple indicators we are making our template complicated and it doesn’t mean to get more returns or more profits from the markets, keeping the template simple is the most important thing for the market participant, simple the template higher the accuracy.
MOMENTUM INDICATORS
RS (RELATIVE STRENGTH) BY BHARAT TRADER
RS by BHARAT TRADER is one of the leading indicator which teels us in advance before the things took place.It is exclusively available on the TradingView platform.
The simple thing is that
‘DOCTOR TOOK THE ECG OF THE PATIENT HAVING CHEST PAIN, SIMILARLY WE ARE STUDYING THE ECG OF THE STOCK MOVES’.
By doing this Technical Analysis we can say that the trend is Going Or had Gone. In simple language we are diagnosing the ECG of the stocks, this concept is Technical Analysis, also we can do the position sizing as well. If the stock moves in my favour we can add more, trail the Stop Loss, ride the momentum till it exists.
It promotes the MOMENTUM INVESTING in which there are number of Entry and Exits but we are able to protect the capital and also the DECAY OF CAPITAL is avoided (i.e. Capital is allocateded and no returns) this situatuion is over come and so the MOMENTUM INVESTING is very popular nowadays. As it is quite simple as compared to the VALUE INVESTING also the risk factor is more in the value investing and if we go for momentum ionvesting then the risk factor is minimal.
TIME FRAME
To ride the entire trend the time frame is very important (i.e for what time frame we are entering into the trade ?)
DAILY CHART (For Swing Trade) [7 to 10 Days] SETTINGS [RS PERIOD 55]
WEEKLY CHART (For Positional Trade) [1 to 2 Months] SETTINGS [RS PERIOD 21]
MONTHLY CHART (For Long Term) [More than 2 Months or a Year] SETTINGS [RS PERIOD 12]
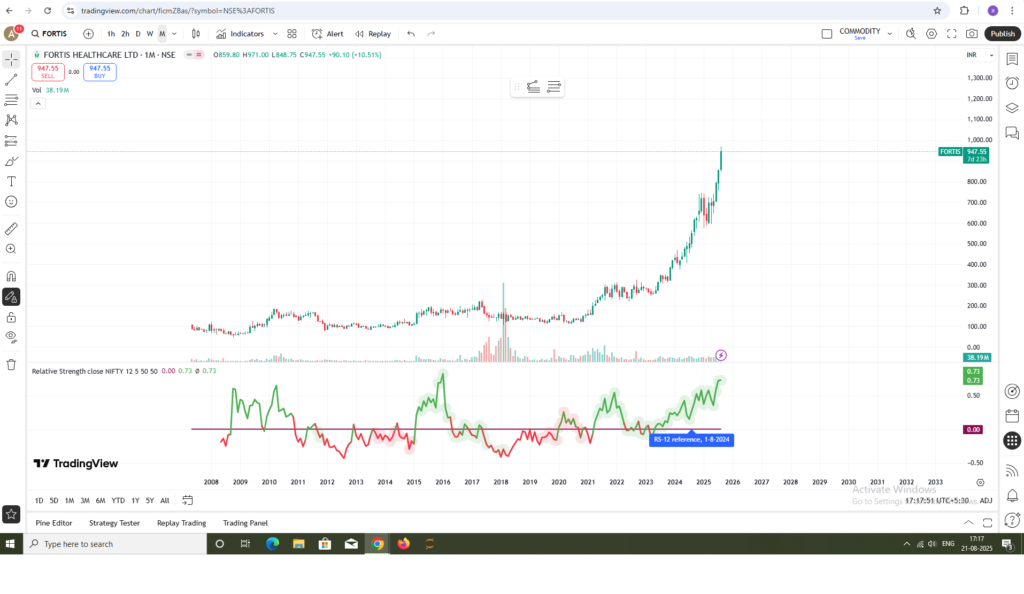
FORTIS HEALTHCARE LTD
As we can see that the stock had performed very well in the long term, if I am interested to invest in this stock for long term then this Indicator is very helpful. The Green and Red wave in the chart is the RS INDICATOR (BY BHARAT TRADER).
A Small Setting which is to be done PERIOD 12 (YEAR COMPRISES OF 12 MONTHS) so thats why 12 should be entered there as shown in the image.
Please refer to the Settings for RS Indicator according to the time frames as mentioned above, here also the same logic to change only the first period as per the information mentioned above.
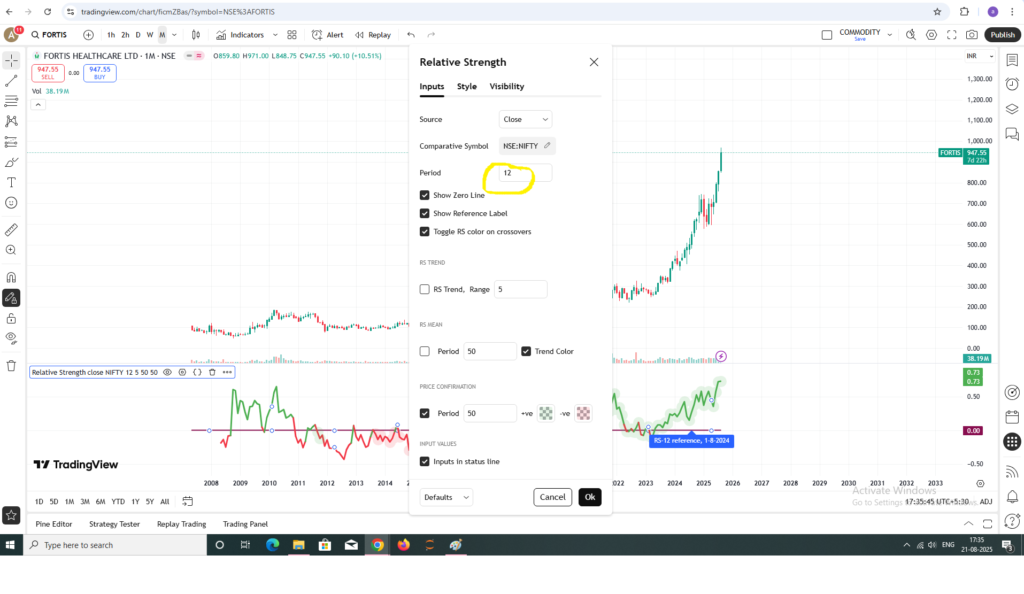
So as you can see that I had set it to 12 so make sure to change only the PERIOD which is at the first option no change to the further PERIOD sections keep it as it is.
RS INDICATOR SIGNIFICANCE
Mostly used in the scenarios in which the markets are not performing well and we are supposed to find an opportunity in the markets. This indicator gives a clear idea for stock picking STOCK PERFORMING WELL IN FALLING MARKETS IS THE NEXT GEM IN THE RISING MARKETS AS WELL, and if that particular stock is the part of the PORTFOLIO then it’s all good.
🔻 Market Highlights on June 4, 2024
- Sensex plunged 6,200 points intraday, eventually closing 4,390 points lower at 72,079 — a drop of 5.74%.
- Nifty 50 broke below the 22,000 mark, hitting an intraday low of 21,281 and closing 1,379 points down at 21,885 — a fall of 5.93%.
- MidCap and SmallCap indices sank up to 12% intraday, settling around 8% lower.
- PSU Banks, Oil & Gas, and Metal sectors were hit hardest, with losses ranging from 10% to 14%.
IN SUCH SCENARIOS THE STOCKS WHCIH ARE IN THE UPWARD MOMENTUM ARE THE CLEAR WINNERS OF TOMORROW
EX. HUL (HINDUSTAN UNILEVER LTD) (▲+6.16%)
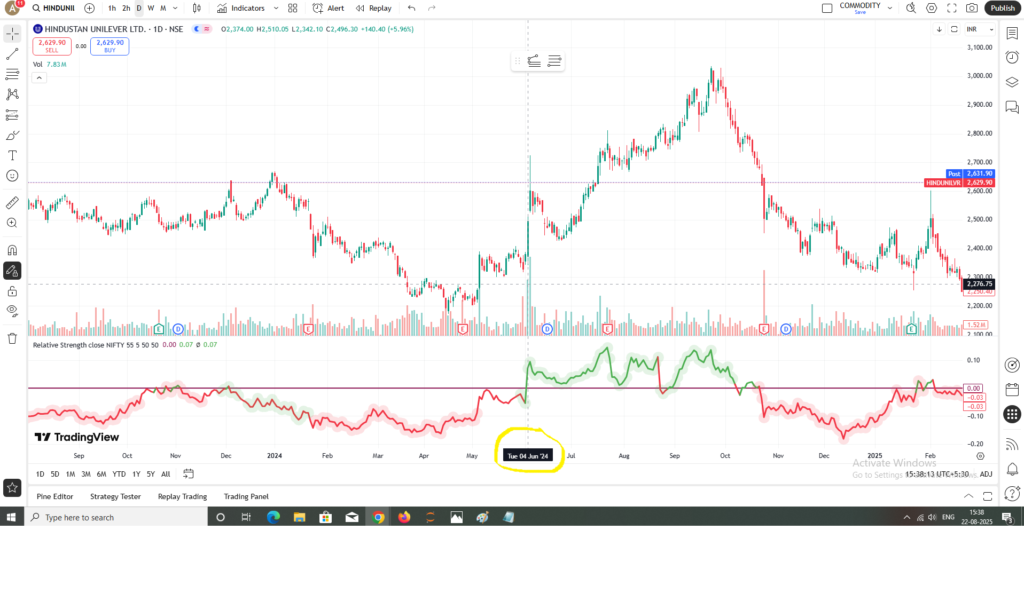
The 4th June 2024 was a tough day for all of us but in such huge fall this stock showed strength, this is the magic of RS indicator.
The RS Indicator compares the strength of the stock with nifty [i.e.We want such stocks which are rising in the falling markets] It is clearly showing that no matters where the markets go but I am going to rise and when the entire markets are on the rise thse stocks are growing like a rocket and when the stock is about to fall it will notify quite early so our massive loss in a stock is avoided, this is the importance of technical analysis.
EX. BRITANNIA INDUSTRIES LTD (▲+3-4%)
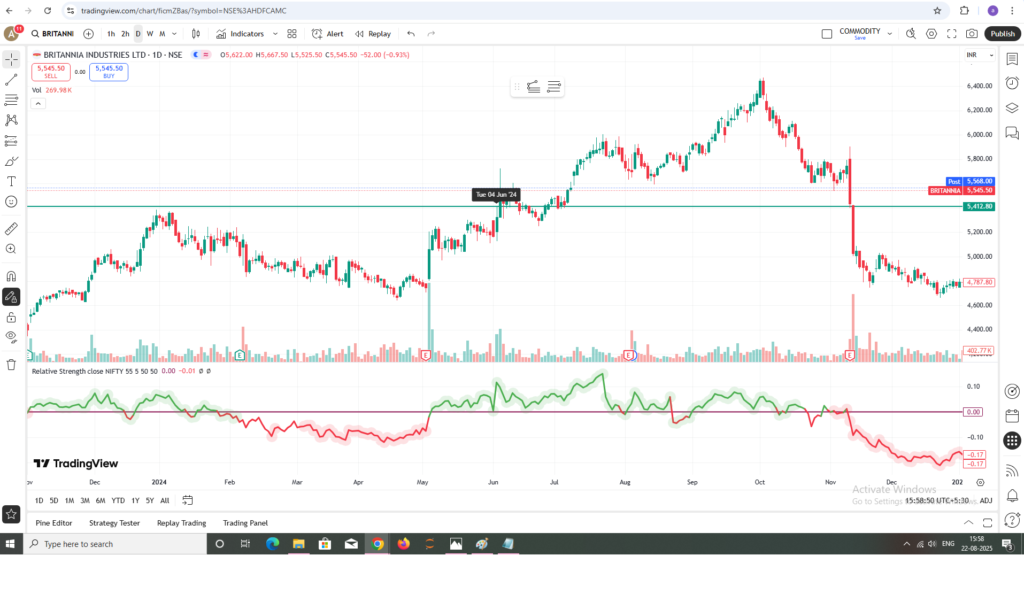
Getting (+3 to 6%) returns in the massive crash is a big thing and when the markets are rising then these should be the stocks on radar to create a huge long position when entire markets are good. On such crash days we can buy few quantities but we get an idea that which stocks are going to perform well in the rising markets and so we can add more when the entire conditions are good and achieve great profits so this is the beauty of the RS tool the magic of technical analysis.
RSI (RELATIVE STRENGTH INDEX)
One more interesting tool is RSI whcih is very similar to RS whcih we discussed before.
These technical tools (indicators are the speedometer of the markets) beacuse of it we can take firm decisions and on right time as well.
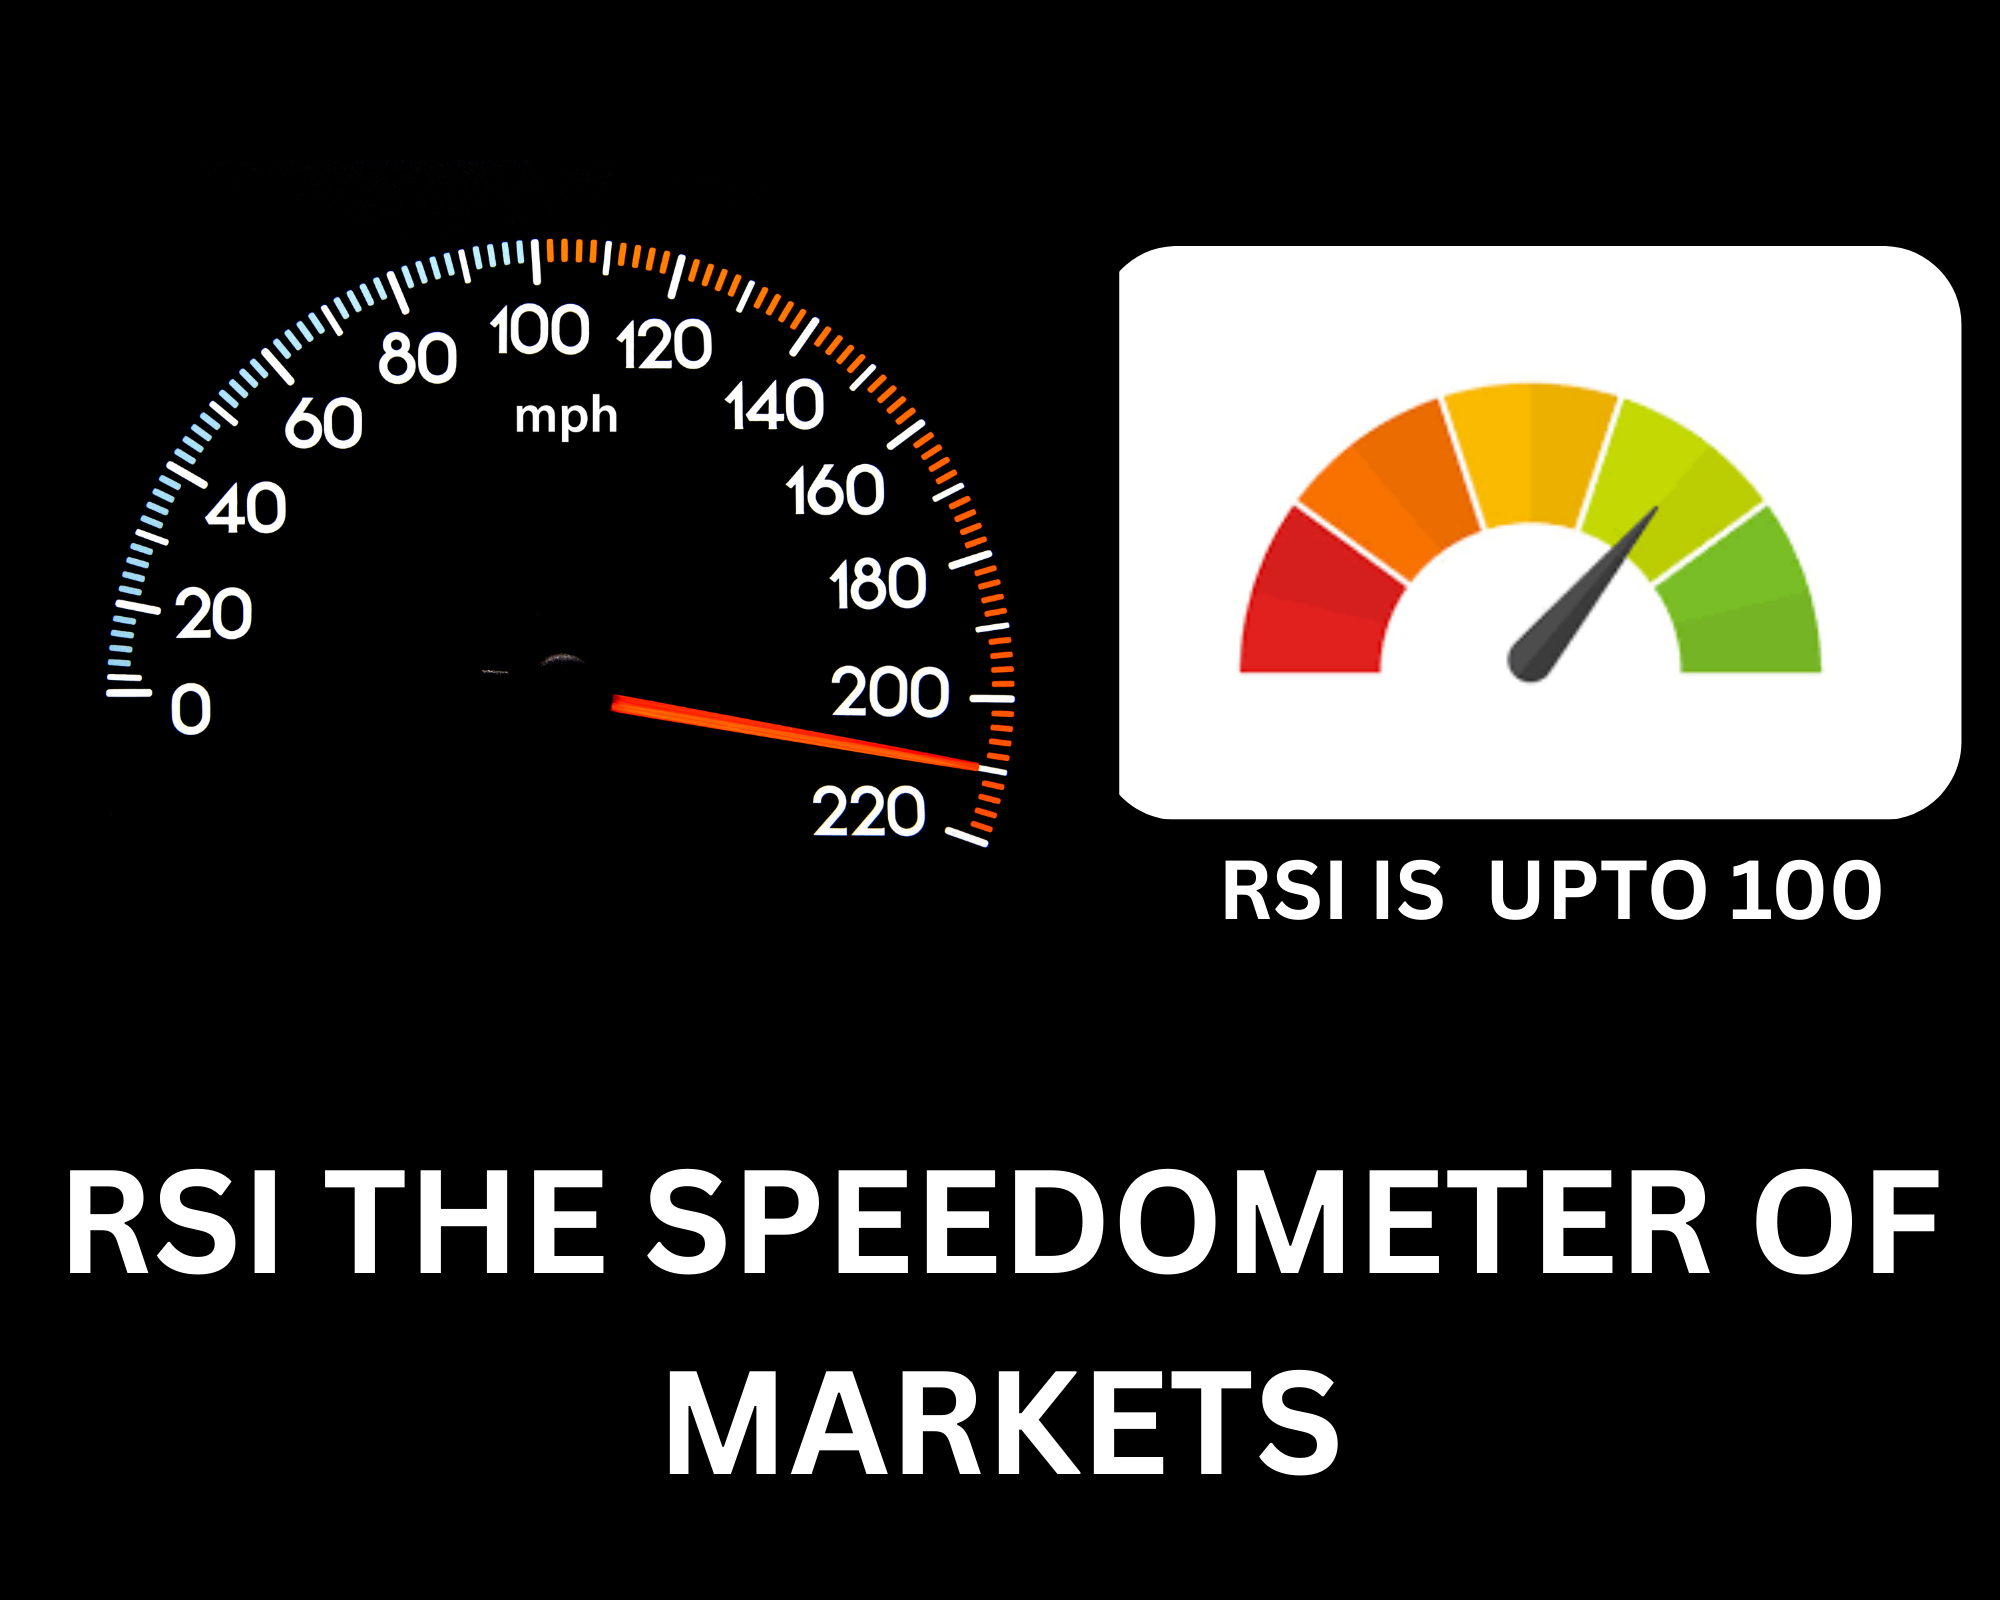
RSI is a Leading indicator which indicates quite early before the trend is going to change it gives us indication for mometum and the value investing as well.
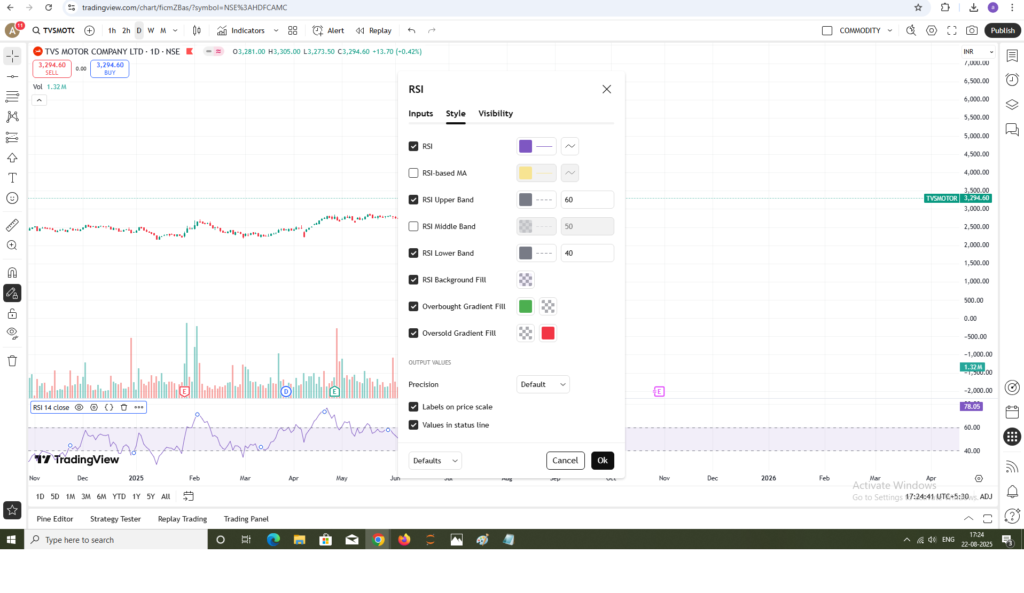
RSI SETTINGS should be as follows
Go to trading view and in the indicators section select the RSI, it will be applied to the chart then go to setting of rsi tool
Enter (60 for upper band) and (40 for lower band)
STRATEGY
BULLISH (RSI>60)
BEARISH (RSI<40)
SIDEWAYS (RSI 40-60)
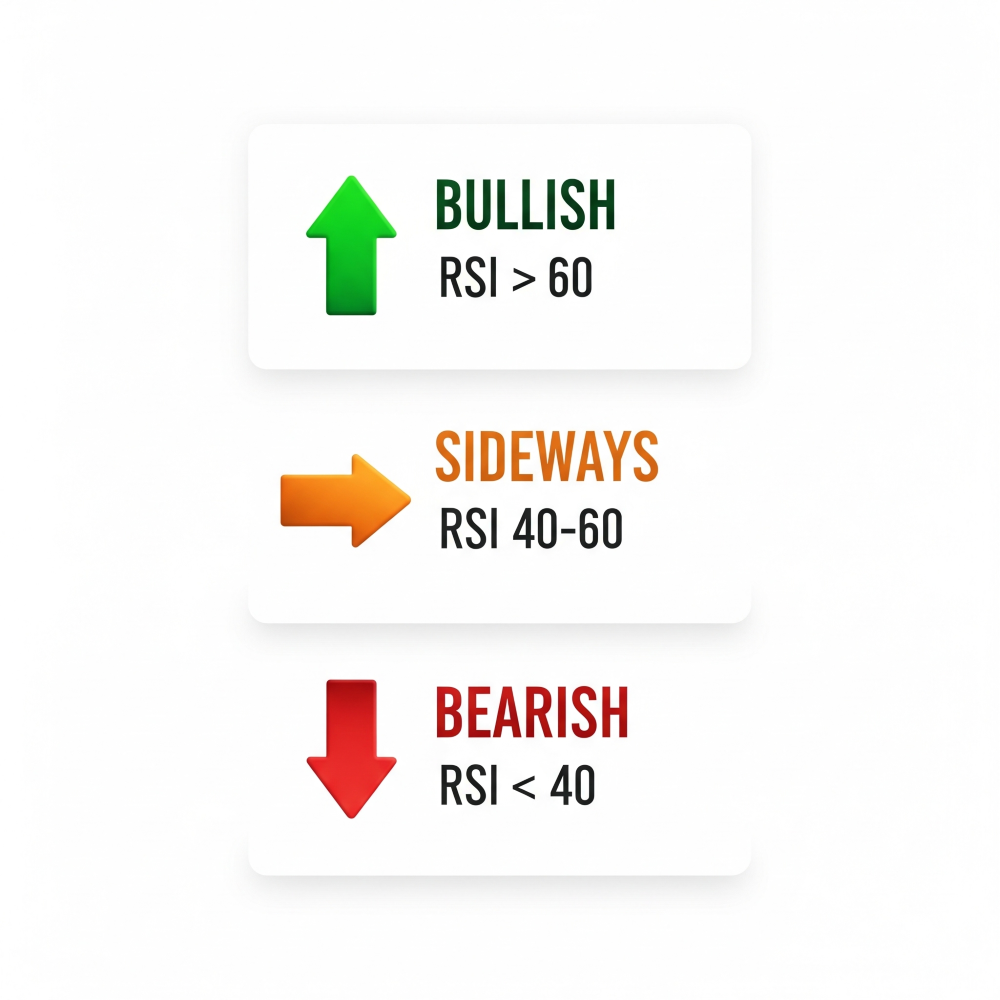
This strategy is also align with the Time frame as discussed in the RS Tool it is as follows :-
DAILY CHART (For Swing Trade) [7 to 10 Days]
WEEKLY CHART (For Positional Trade) [1 to 2 Months]
MONTHLY CHART (For Long Term) [More than 2 Months or a Year]
So the main Strategy
1. BASIC-: RSI (DALIY AT 40, WEEKLY>=60, MONTHLY>=60) the overall trend is bullish and we can ride the trend as long as it exists.
2. ADVANCE-: RSI (DALIY>=60, WEEKLY>=60, MONTHLY>=60) the overall trend is bullish and we can ride the trend as long as it exists.
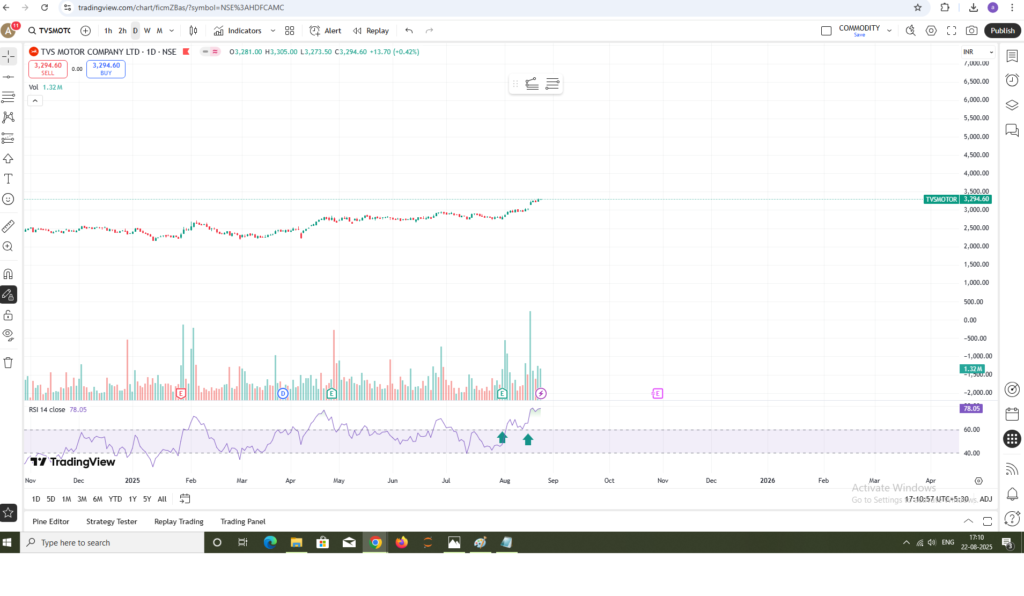
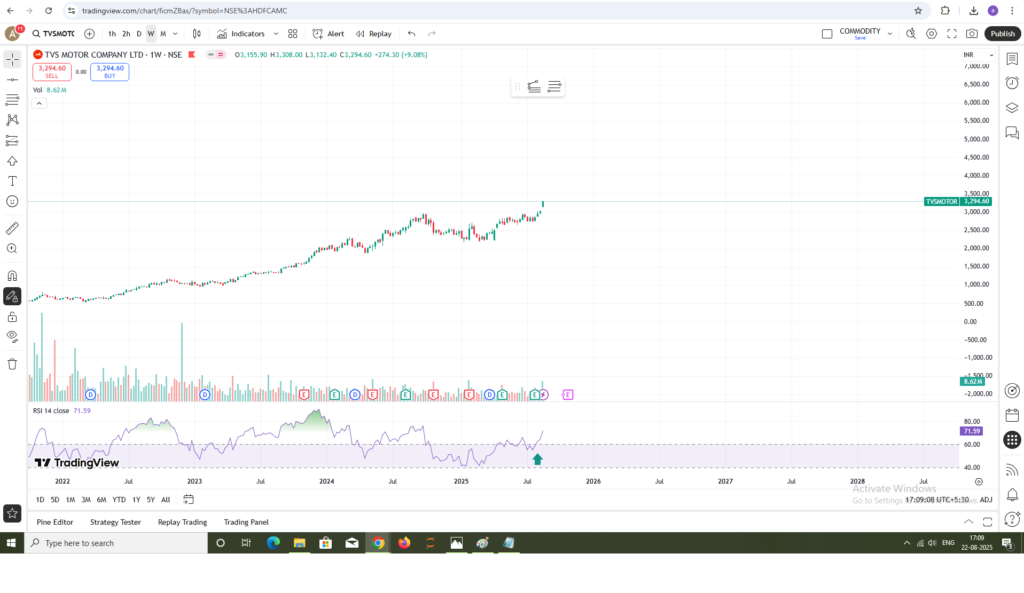
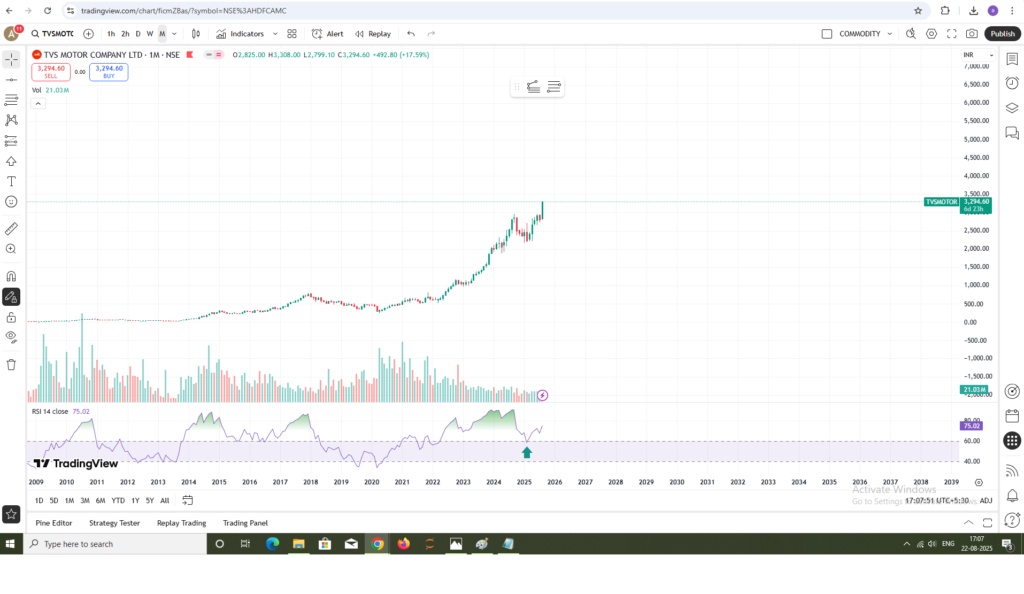
The longer time frame MONTHLY chart shows that for longer duration the stock is bullish, WEEKLY charts shows that for a positional trade duration the stock is bullish, DAILY shows that for a few days the stock is bullish. We can conclude that for lower to higher duration the stock is quite well to consider for taking the position.
In Technical Analysis the strong supports are described by [RSI 40 SUPPORT Value Buy], [RSI 60 SUPPORT Strong Support] so this strong supports are said to be the ideal for Entering the trade.
As we can see in the chart of TVS MOTOR COMPANY the stock was at 60 SUPPORT in all time frames [DAILY, WEEKLY, MONTHLY] it was a great opportunity to enter the trade as the momentum is at start and a huge move is there to capture. So a long duration of strong trend is still on the rise as we can see in the images the stock had crossed the 70 range and also could continue to grow. Maximum RSI Limit [upto 100], generally a stock goes to [90 to 95 RSI] and then, a reversal [A Short Falling could be seen] and again when it takes a support on 60 we can enter again after having an exit.
The thing is that, there might be number of Fundamental reasons behind the stock moves but the Technical is the major reason and it could be studied quite easily.
CHART IS YOUR FRIEND
Fundamentals are the old information because company releases the Concall Analysis, Quaterly Results,Profit and Loss statements are published after every 3 Months and based on that information we analysising that the company is perfoming conssitently or not, but the chart speaks even before the release of the above mentioned information. So via Technical Analysis we could get the latest information much early as first chart tells us that whether a stcok is performing well or not and based on that data the Concall, Profit and Loss, Quaterly Results are released. At the earliest we can make the firm decisons of Entry, Pyradmiding (i.e. To buy more quantities), Exits.
In the Markets doesn’t matter if you are an Investor or Trader but to sustain in the markets Timely exit plays a major role as the profits are generated by following the rules and the setup strictly and when it’s time to exit then without being emotional the exit should be done no any kind of ABHIMANYU in the markets, if you are then you are not going to sustain in the markets for a longer duration.
MONTHLY AND WEEKLY CHARTS FOR DEFINING THE TREND AND DALIY CHART FOR ENTRY .
We shall cover the ENTRY and EXIT template in the next post , see you in the next post till then
STAY HUNGRY STAY BULLISH
1.You talk about “Momentum Indicators.” What’s the main idea behind using them?
Think of them as a speedometer for the stock. The article explains that technical analysis is like reading an “ECG of the stock” to see if its trend is healthy, speeding up, or slowing down. These indicators help you “diagnose” the stock’s momentum (strength) so you can make smart decisions on when to get in, add more, or get out before a massive drop.
2. This article mentions two “RS” tools. What’s the difference between “RS (Relative Strength) by Bharat Trader” and “RSI (Relative Strength Index)”?
It’s a great point of confusion, but they do different jobs!
RS (Relative Strength) by Bharat Trader: As the post explains, this tool compares the stock’s strength against the market (like the Nifty). It helps you find stocks that are “rising in the falling markets,” which are often the next big winners.
RSI (Relative Strength Index): This is an internal speedometer. It measures the stock’s own recent gains against its recent losses to tell you if it’s “overbought” (too hot) or “oversold” (too cold).
3. The post shows HUL and Britannia as examples from a market crash. What was the lesson there?
That was a perfect example of the RS by Bharat Trader tool in action. The main takeaway was that even when the entire market was crashing (down 5-8%), these stocks were going up. The magic of the RS tool is that it helps you spot these “clear winners” that show immense strength in a weak market. These are the first stocks to put on your radar because, as the article says, “when the entire markets are on the rise thse stocks are growing like a rocket.”
4.I see the RSI strategy uses “60” and “40.” What do those numbers mean?
This is a specific (and very popular) strategy the article lays out. Instead of the default 70/30, you change the RSI settings to 60 and 40. The simple rules are:
RSI > 60: The stock is in a strong bullish momentum.
RSI < 40: The stock is in a bearish momentum.
RSI 40-60: The stock is moving sideways (no clear trend).
This helps you quickly identify the trend and even find strong support, like when a stock pulls back and “takes a support on 60” before moving up again.
5.Why does the article say “Chart is Your Friend” and that fundamentals are “old information”?
The post makes a really interesting point here. Fundamental reports (like quarterly results and profit statements) are only released every 3 months. That’s “old information.” But the chart (technical analysis) shows you what’s happening right now. The chart often moves before the good or bad news is officially announced. By learning to read the chart, you can get the latest information much earlier and make timely decisions about your entry and, just as importantly, your exit.


